

Overview
CO2MPASS is an interactive dashboard to support the Network manager Operational Performance Framework. It is designed to support policy makers and operational stakeholders to understand areas of operational improvements.
Updated daily, and storing 14 rolling months of results, CO2MPASS provides users with access to comprehensive data giving insights into fuel burn through each phase of flight (climb, enroute and descend) and each ACC or TMA. The flight trajectory is “Wheels-up/Wheels-down”.
Users can determine how their actual performance compares to their planned performance and can take measures to adapt their planning in the future. The dashboard provides three different views with several filters:
- Network view: it allows users to assess the estimated fuel burn (or CO2emissions) for every flight within the NM area, covering the trajectories of all intra-NM and international departures/arrivals to/from the point of entry/exit of the NM Area. This allows visualising the effects that wide-body and very large aircraft have on fuel burn (hence CO2 emissions), that would not be visualised when restricting the scope to intra-NM Area flights. High level visualisations provide the number of flights and the total fuel burn in tons. User can also see the distribution of fuel burn by each phase of flight. Additional insight can be found from visualisation aggregated in flow, market segment and aircraft category.
- Operator view: designed for air operators to assess the fuel burn for each of their flights covering the full trajectories of all intra-NM and international departures/arrivals. This provides additional insight into their planned (using FTFM) versus actual (using CTFM) fuel burn performance for each phase of flight, listing the ACCs (or TMAs) as well where they experience the highest estimated fuel burn performance in terms of fuel burn per flight.
- ANSP view: designed for ANSPs to assess the fuel burn of every flight that entered their ACCs, covering the part of each flight trajectory within the defined ACC area. This page also provides additional insight into the operators planned (using FTFM) versus actual (using CTFM) fuel burn performance through each phase of flight, listing the operators that experience the highest estimated fuel burn performance in terms of fuel burn per minute.
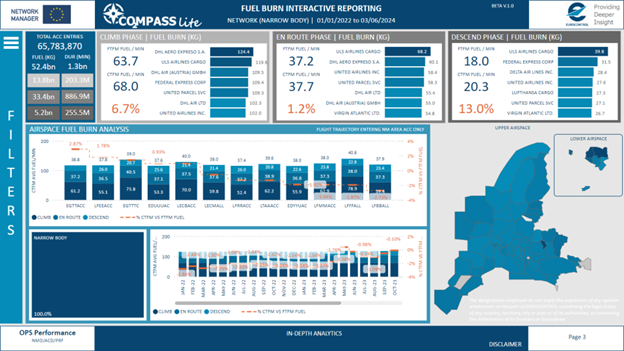
CO2MPASS – ANSP view (from webpage)
Three roles exist for users outside of the EUROCONTROL Agency:
- ANSP role: users can see all available details for flights that passed through their ACC/FAB. Filters are set for ACC entry flight. Different ANSPs crossed by a flight can see the same data.
- Air Operator role: users can see all available details for flights based on ICAO_AO_ID. AO Group roles also exist allowing access to all the flights of a specific airline group.
- Airport role: users can see all available details for flights that departed or arrived at their airport. Airport group roles also exist.
Access to CO2MPASS can be granted to operational stakeholders via the webpage of the tool. Users see data that is relevant to them.
CO2MPASS User Guide available via the dashboard.
Provider
The dashboard is developed and provided by the Network Manager (NM) Operational Performance Unit.
Limitations
The dashboard provides CO2 estimations for the portion “Wheels-up/Wheels-down”, not considering emissions produced during the taxi phase.
Future Developments
Developments are ongoing to use B2B data to allow real time data visualisation, allowing e.g., airspace users visualising the situation of the morning rotation.