

Overview
The Network Manager interactive analysis tool (FATHOM) is a data analytics dashboard provided by EUROCONTROL, offering comprehensive insights into European air traffic management. It provides real-time and historical data on air traffic flows, delays, capacity and network performance across Europe. The data is sourced from EUROCONTROL’s extensive aviation databases, including operational flight data, air traffic management systems and network performance reports.
Users can view interactive visualisations, trend analyses and key performance indicators related to air traffic operations. The dashboard is designed for aviation professionals, including ANSPs, airlines, airport operators and policymakers, supporting data-driven decision-making for improving efficiency and planning.
FATHOM can be used for monitoring air traffic trends, assessing network capacity, identifying bottlenecks and enhancing operational strategies. It is accessible through a web-based platform, allowing authorised users to explore critical aviation data in an intuitive and user-friendly interface.
FATHOM Analysis (R35D) and FATHOM Reporting (R14M) are two complementary and separate views of the EUROCONTROL FATHOM dashboard, each serving different purposes.
FATHOM Analysis (R35D – Rolling 35 Days)
- Focuses on interactive data exploration and in-depth analytics related to European air traffic management.
- Provides detailed “Day-1” and historical data up to 5 weeks on air traffic flows, delays, network performance and capacity.
- Users can interact with various visualisations, filter data and conduct customised analyses to gain deeper insights into aviation trends and operational challenges.
- Ideal for aviation professionals who need to explore and analyse data dynamically to support strategic and operational decision-making.
FATHOM Reporting (R14M – Rolling 14 Months)
- Focuses on generating comprehensive reports using aggregated dated up to 14 months.
- The purpose is to allow users to create and share detailed reports that summarise operational performance and identify areas for improvement.
- It provides customisable reporting options, enabling users to present data in a clear and structured manner. As such, it can also meet the needs of managers.
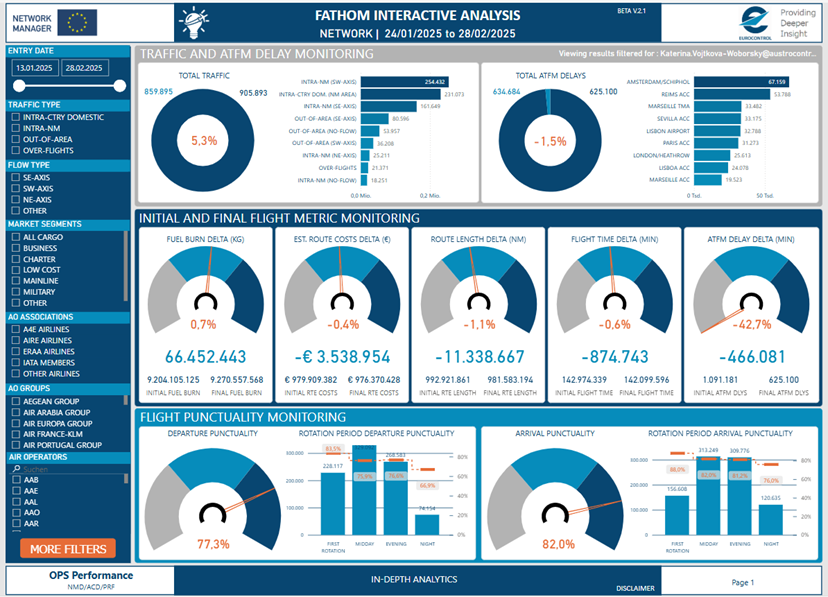
FATHOM – General view (from webpage)
The FATHOM Reporting User Guide is available via the dashboard.
Provider
The dashboard is developed and provided by the Network Manager Operational Performance Unit.
Limitations
The R35D view provides data up to 5 weeks (35 days) in the past, which may be considered not enough, even for analysis purposes.
Future Developments
Developments are ongoing to use B2B data to allow real time data visualisation, allowing e.g., airspace users visualising the situation of the morning rotation.