

Overview
The Flight Level Adherence Interactive Reporting dashboard (FLair) provides users with flight level details to those flights that did not adhere to the filed (requested) flight level at some point during their route.
Non-adherence to the RFL is referred to as “Off RFL” in the dashboard and is considered anytime a flight is above/below 1000 feet from its RFL (see below). The dashboard can provide details for non-adherence to RFL in terms of distance (in nautical miles) and illustrates the performance (adherence) using two performance indicators:
- Nr of flights “Off RFL”.
- Distance “Off RFL”.
The RFL adherence is based on the following elements:
- The FTFM and CTFM point profiles are compared:
- First NAV point where Actual FL=RFL is considered as “Top of Climb” (ToC).
- Last NAV point where Actual FL=RFL is considered “Top of Descent” (ToD).
- The Adherence to RFL is measured only between ToC and ToD.
- The RFL adherence metrics are then calculated as follows:
At least two common points at >= 1000 ft generates a “distance” where a non-adherence to RFL is calculated.
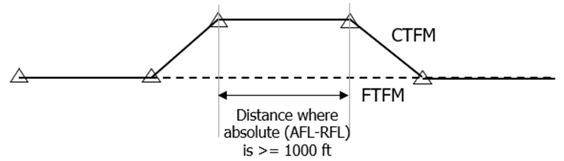
- The RFL (non-)adherence indicator is then:

RFL (non-)adherence indicator (from FLair Info Doc)
The dashboard provides three different pages with several filters:
- Overview: this page is the landing page for all users. The page provides a “global” view of their performance based on the user’s role. There are some high-level visualisations that provide the number of flights and the total distances that the flights were “Off RFL”. There is also aggregated views that provide additional insight, illustrating specific air operators, airspaces (TMAs & ACCs) or specific city-pairs that demonstrate the worst performance in terms of flights being “Off RFL”.
- Operator: it provides an air operator perspective on the number of their flights and total distance that flights were “Off RFL”. Users will find the same filters and several other visuals that will provide insight into the non-compliance of requested flight levels. Each visual is interactive, and clicking on any visual will update the other visual to reflect the results of the selected subset of data.
- Airspace: this page provides an airspace perspective for non-adherence to the requested flight levels. With the same filters as the previous pages, users can quickly drill down to see specific operational results. Some high-level numbers provide the number of flights, total distance and proportion of flights that did not adhere to the requested flight levels. A treemap visual allows users to quickly identify the airspace with the lowest compliance to RFL adherence. Clicking on this visual will update the map and tables to reflect the results of the new data subset.
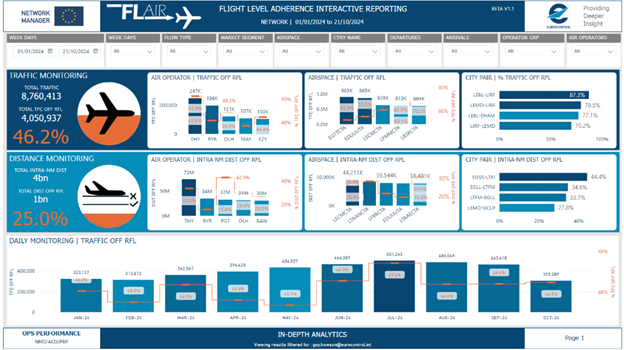
Flair Overview (from FLair Info Doc)
Provider
Like CO2MPASS and FATHOM, the FLair dashboard is developed and provided by the Network Manager (NM) Operational Performance Unit.
Limitations
Currently, non-adherence is looking at any deviation with an absolute value of 1000ft or above without distinction between below or above the RFL.
Future Developments
To lift the limitation mentioned above, it will be possible to make a distinction between “above RFL” and “below RFL” on top of “Off RFL”. Developments are ongoing to use B2B data to allow real time data visualisation, allowing e.g., airspace users visualising the situation of the morning rotation.