

Overview
The EUROCONTROL TMA Flight Efficiency Dashboard is an interactive tool that helps analyse and improve the efficiency of flight operations within terminal areas. It also helps identify and prioritise sources for improvement as part of a collaborative process involving all parties (service providers, airspace users, authorities).
The dashboard provides operational insights into both permanent and variable inefficiencies as proxies for airspace versus operations. It provides a detailed view per airport, runway and flow.
Permanent inefficiencies (such as level-off or path extension) are related to airspace design (e.g., because of flow segregation or noise constraints), while variable inefficiencies (such as vectoring) are linked to operational practices caused by sequencing, metering and obviously separation. This distinction helps in targeting specific areas for improvement.
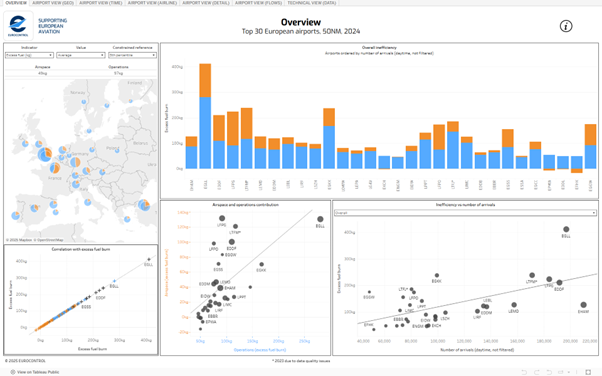
TMA Flight Efficiency Dashboard – Overview page
The observations are based using the following trajectories:
- Flown trajectory, which is the observed trajectory based on radar track (typically from 50Nm to 5NM to the runway threshold but can be adapted).
- Constrained reference, a sort of ideal flyable trajectory that incorporates any horizontal, vertical or speed restriction applicable to arrivals to an airport, defined statistically (10th percentile of the flown trajectories).
- Unconstrained reference, a sort of ideal flyable trajectory without any constraint, defined by a common principle for all airports (continuous descent, direct to intercept from entry and intercept at 2000ft AGL).
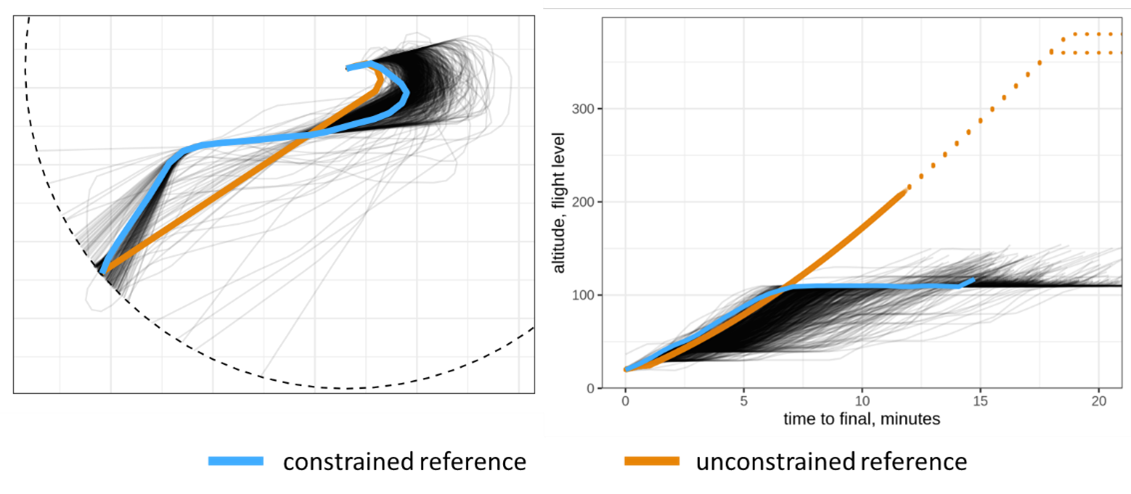
Method – Constrained and unconstrained references
The inefficiencies are determined using principles of deviations from references:
- “airspace” related deviation is obtained by the difference between unconstrained and constrained references;
- “operations” related deviation by the difference between the constrained and flown trajectory.
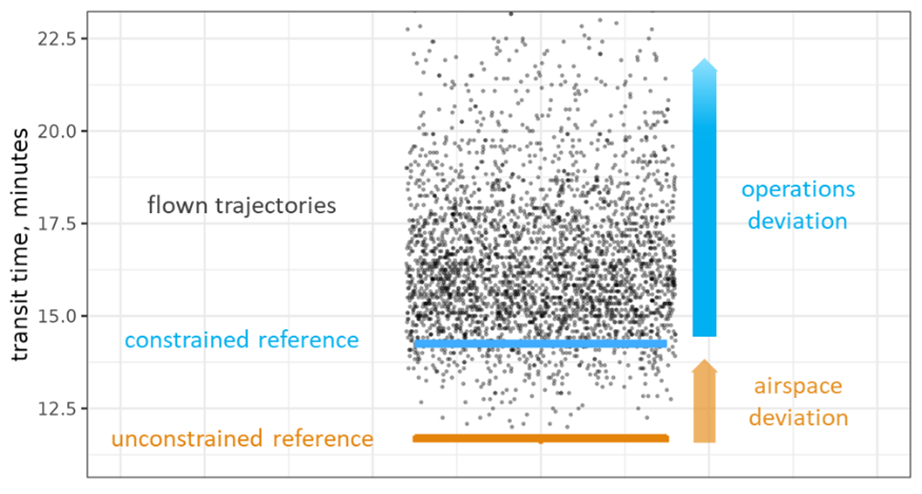
Method – Airspace and operations deviations
The tool has the following key features and functionalities:
- Data Visualisation: The dashboard provides a visual representation of flight efficiency metrics. This includes graphs and charts that display various aspects of flight performance, and includes representations of flown, constrained and unconstrained profiles, making it easier for stakeholders to understand and analyse data.
- Efficiency Metrics: Several indicators are proposed to support the measurement of flight efficiency along different dimensions: horizontal (time, distance deviations), vertical (altitude, average altitude deviations) and 3D (excess fuel burn in kg, or %). Different aggregations (average, median, sum over the year) and detailed view allow the detailed identification and prioritisation of arrival inefficiencies per flow.
- Interactive Analysis: Users can interact with the dashboard to drill down into specific airport, runway and flow, and analyse trends over a year. This interactivity allows for a more detailed and customised analysis.
- Stakeholder Engagement: It is designed to be used by various stakeholders, including operational staff, airspace users, data analysts and decision-makers. The dashboard facilitates information sharing and collaborative decision-making.
- Environmental Impact: By quantifying the reduction in fuel and excess fuel consumption, the dashboard helps in assessing the environmental benefits of different operational improvements.
Provider
The dashboard has been developed by the EUROCONTROL Innovation Hub with the support of the Aviation Sustainability Unit, as a contribution to the ATM/ANS Environmental Transparency Working Group.
Limitations
The dashboard presents data for the top 30 European airports (and with a maximal range of 50NM around the airport).
The accuracy of the dashboard insights depends on the quality and completeness of the data it receives. Incomplete or inaccurate data can lead to misleading conclusions.
The dashboard provides historical information for the last three years (currently 2022, 2023 and 2024). It does not present real-time data.
Future Developments
Future Developments will include the analysis of departures (in progress).